Optimizing Voter Turnout
Data-Driven Resource Allocation in Georgia
Authors:
Angelina Zhang (ruz039@ucsd.edu)
Cici Xu (xix015@ucsd.edu)
Mentor: Babak Salimi (bsalimi@ucsd.edu)
Introduction
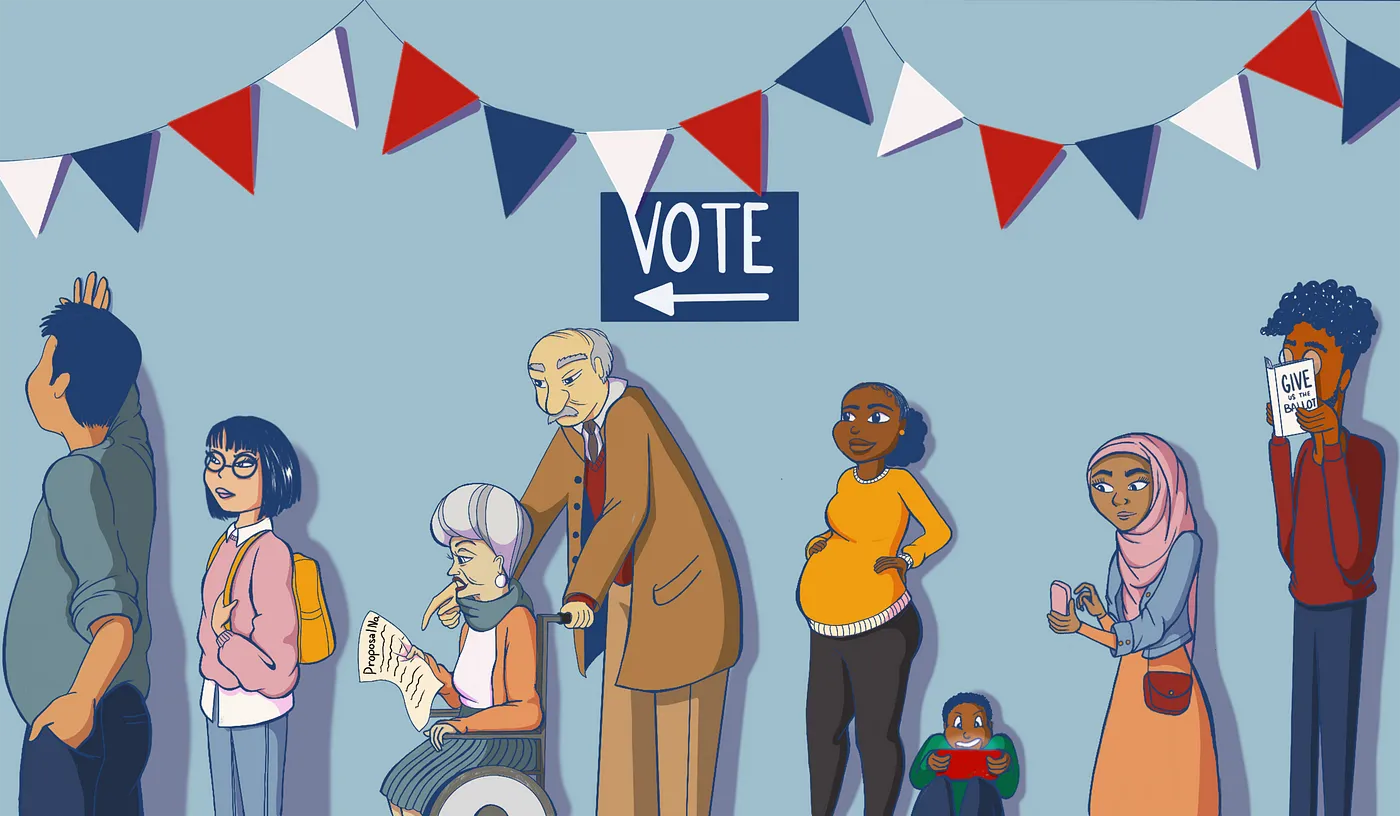
Do you know that persistent disparities in voter turnout across racial and socioeconomic groups continue to challenge democratic participation? While various initiatives aim to increase overall voter engagement, inequities in resource allocation disproportionately affect underserved communities.
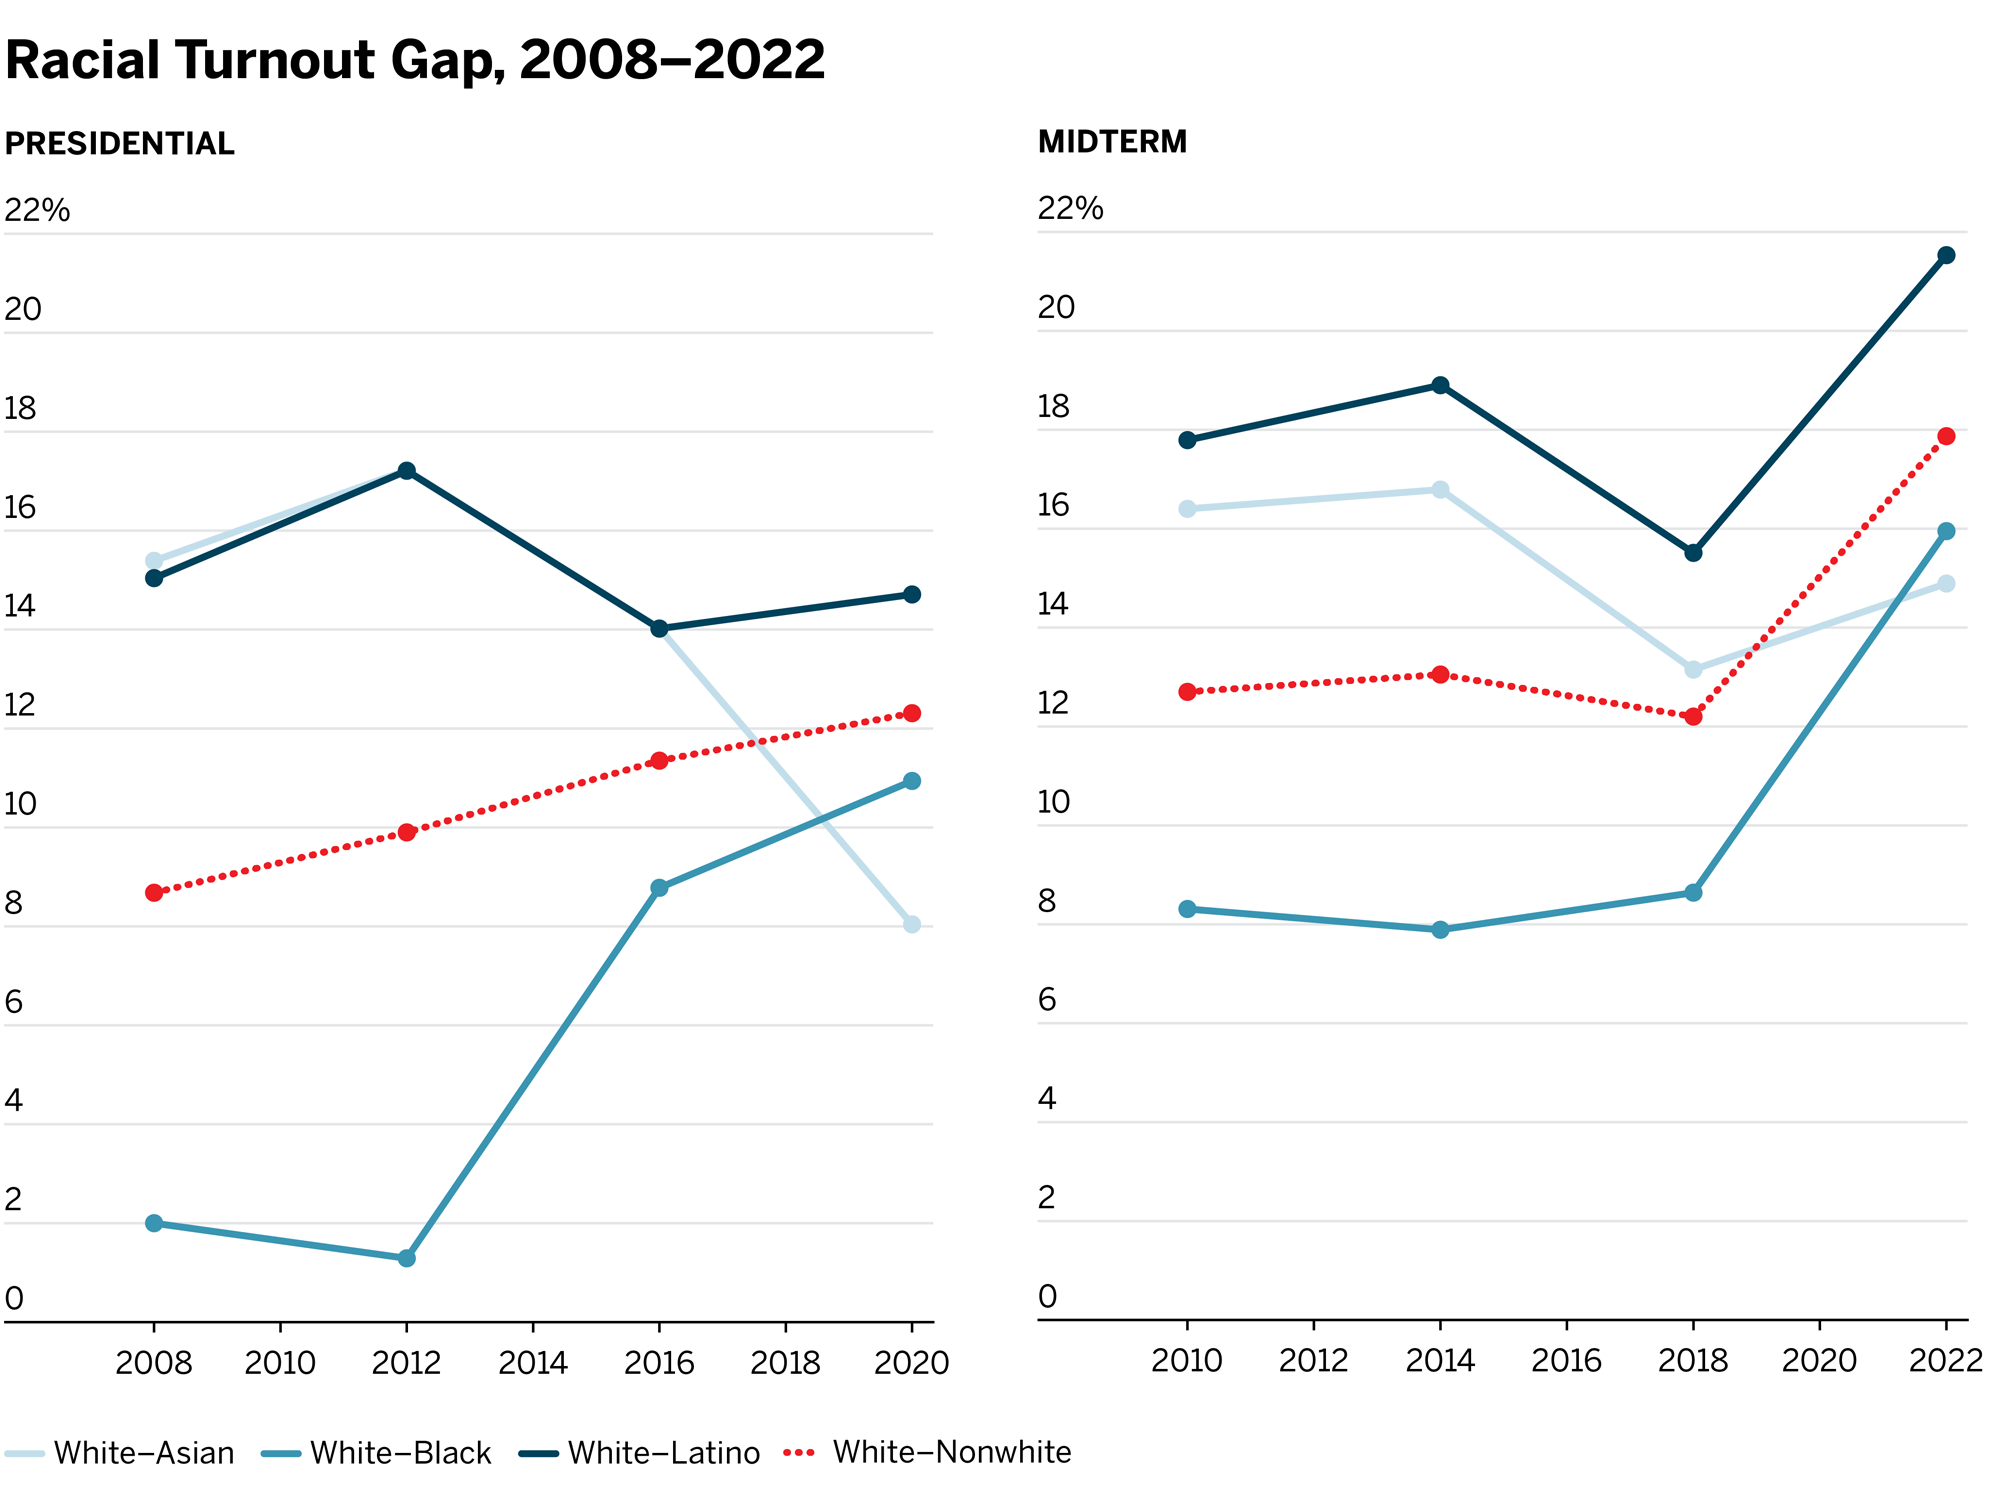
Source: Brennan Center for Justice
What if smarter polling station placement could significantly boost voter turnout — especially in communities that have been historically underserved? Our project uses Structural Causal Models (SCMs) and Mixed Integer Programming (MIP) to strategically optimize polling station placement aiming to:
- Maximize overall voter turnout.
- Reduce racial disparities in voting access.
- Operate within a fixed budget.
By combining election data, census demographics, and fairness constraints, we build models that answer a critical question:
Where should polling stations go to make the most impact — both in turnout and equity?
Research Context
Georgia emerged as a pivotal swing state in the 2020 U.S. presidential election, marking its first Democratic presidential victory since 1992. Joe Biden secured a narrow margin of 11,779 votes (0.24%), highlighting the state's evolving political landscape. This shift was driven by demographic changes, grassroots mobilization, and evolving voter engagement patterns.
While high voter turnout, particularly among historically underrepresented communities, was crucial to this outcome, systemic barriers persisted. Issues such as extended wait times, polling place closures, and unequal resource distribution continued to disproportionately affect certain demographic groups, raising concerns about equitable voting access.
Our research framework addresses these challenges by incorporating fairness constraints into polling station optimization. By analyzing election data and census demographics, we develop actionable strategies that promote equitable resource allocation while ensuring efficient voter participation across all communities.
Explore polling station distribution by category
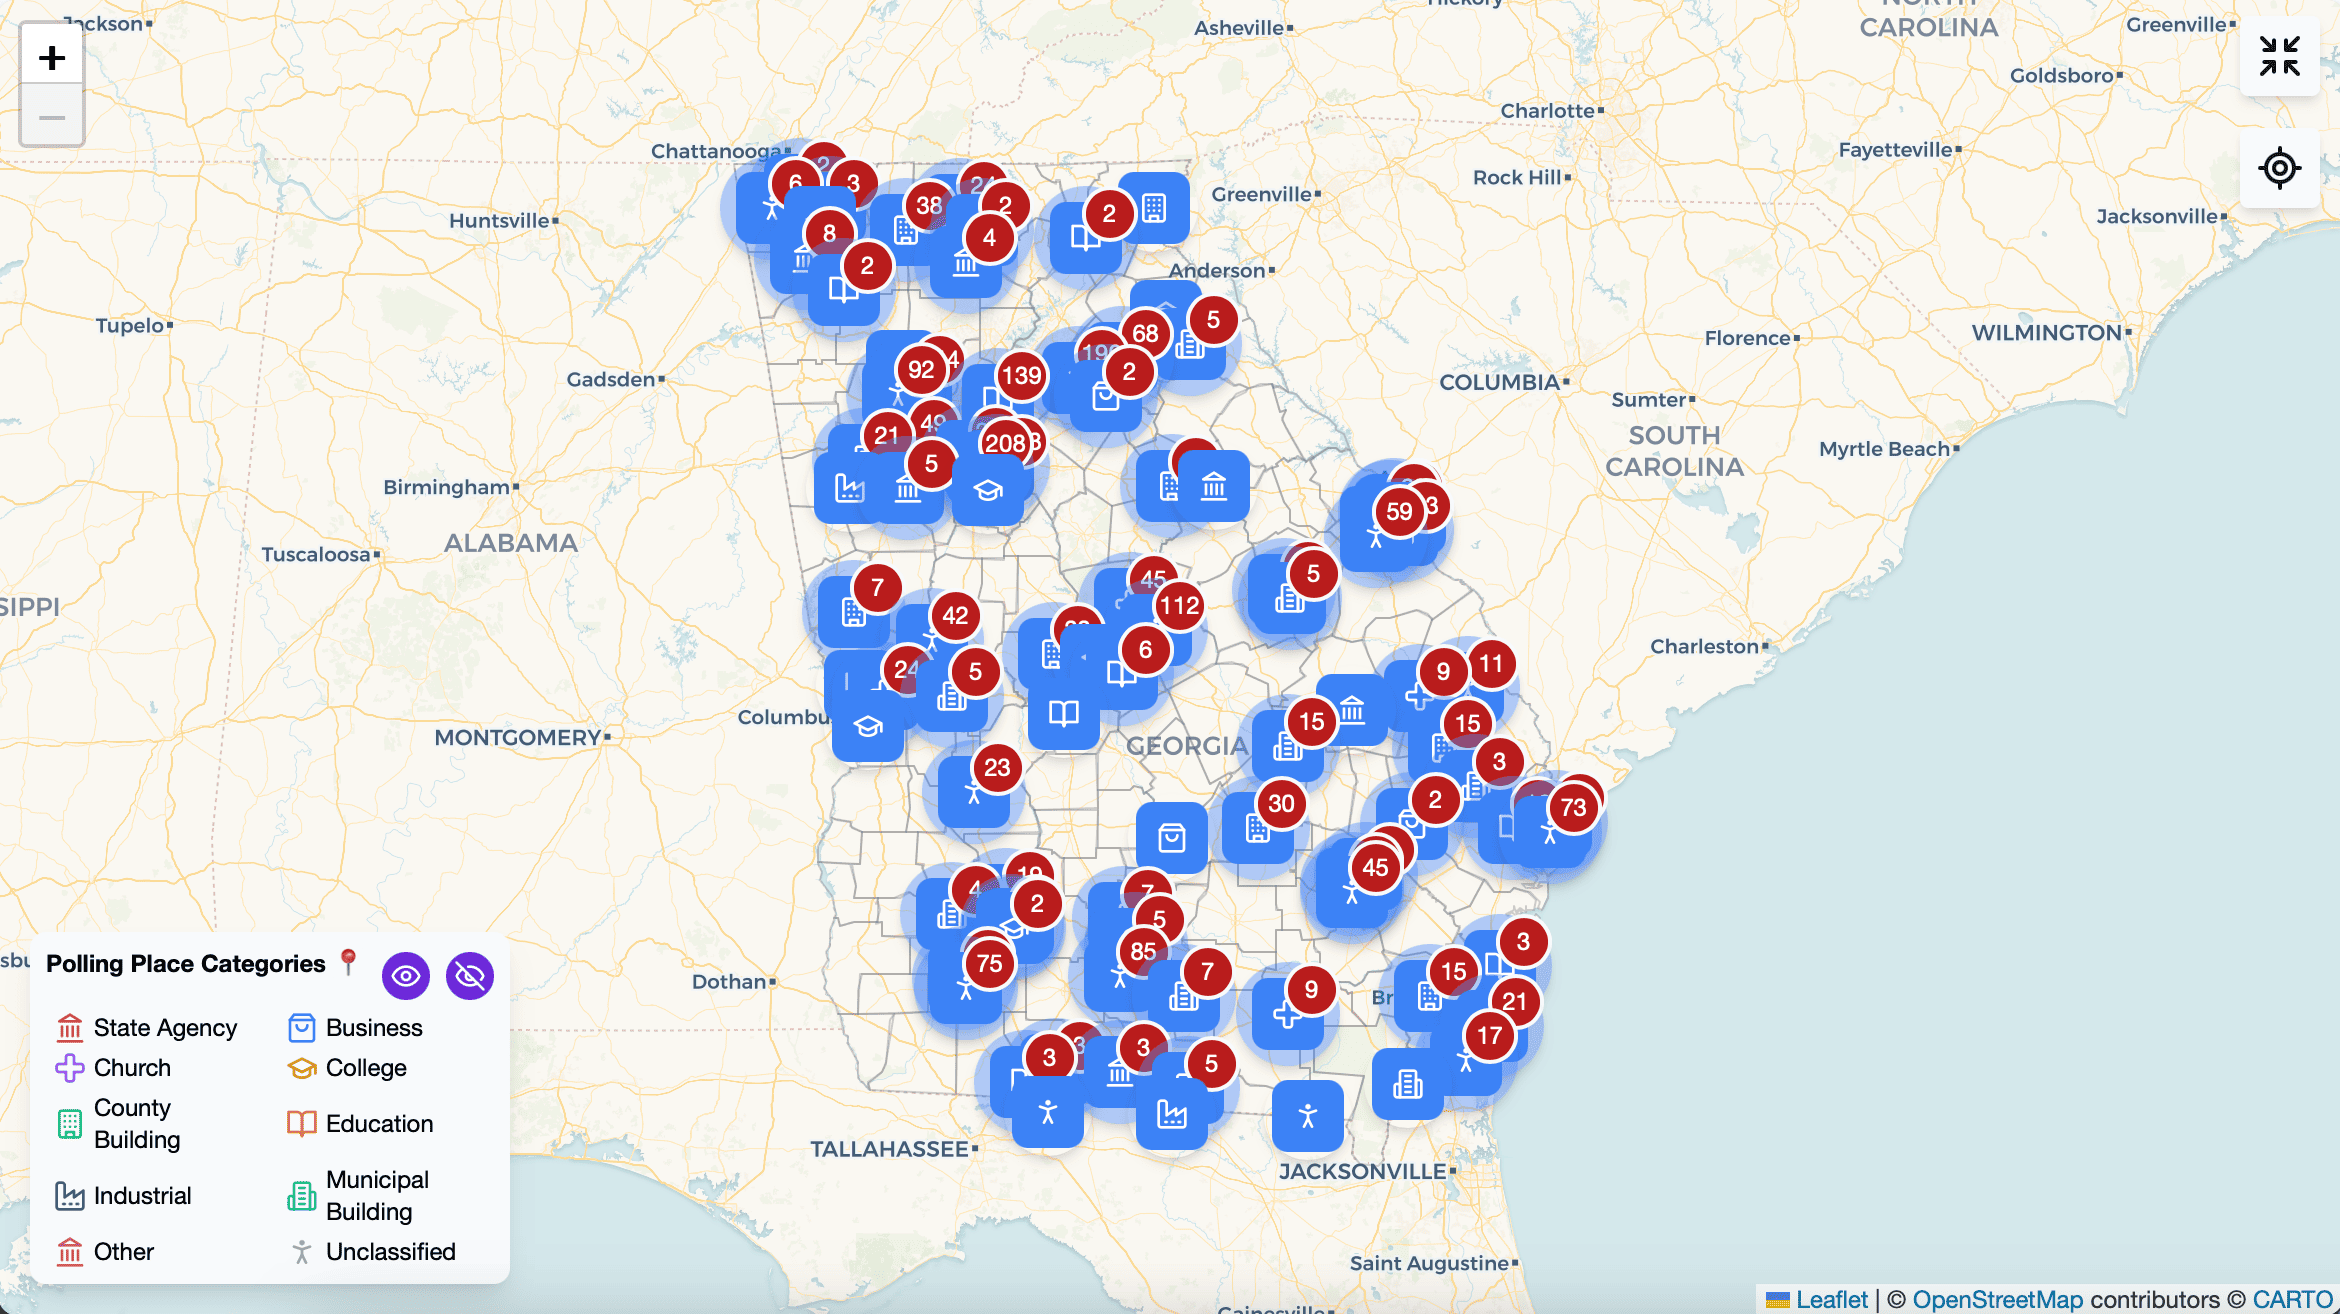
Access our comprehensive interactive visualization to examine polling station distribution patterns, demographic characteristics, and the effectiveness of various allocation strategies across Georgia's counties. Click "Explore Interactive Map" to begin your analysis.
Methodology
Causal Modeling Framework
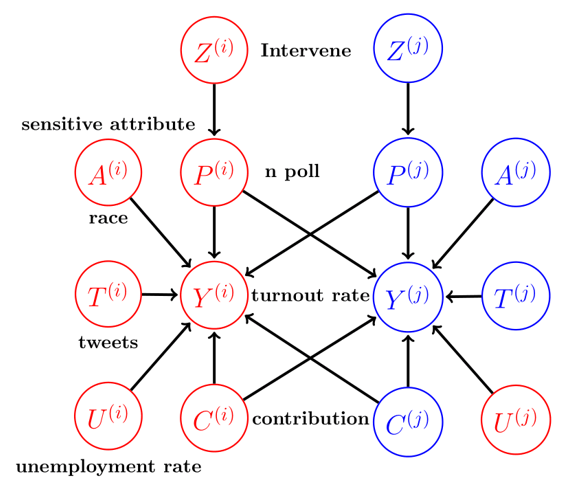
Our framework employs Structural Causal Models (SCMs) to formalize the relationship between resource allocation decisions and their societal impacts. The model is represented as a directed acyclic graph (DAG) with the following components:
- Protected Attributes (A): Demographic characteristics protected against discrimination (e.g., race, gender)
- Decision Variables (X): Features influencing allocation decisions but not legally protected (e.g., tweets, contribution, unemployment rate, number of polling stations)
- Outcome Measures (Y): Key performance indicators including voter turnout
Our approach adopts an individualized modeling strategy, treating each geographic unit as a distinct node in the causal graph. This granular approach enables precise analysis of decision impacts across different communities.
Intervention Modeling
Interventions are modeled as binary decision variables , indicating whether a policy intervention is applied to unit .
- : An intervention is applied.
- : No intervention is applied.
Fairness Constraints
To ensure fairness, we impose constraints on counterfactual privilege, which measures the expected outcome difference due to protected attributes.
The fairness constraint ensures that the disparity between actual and counterfactual outcomes remains below a threshold :
Optimization Problem
Our objective is to maximize the overall benefit of interventions while adhering to fairness and budget constraints:
Subject to:
Georgia State Formulation
In the Georgia dataset, we aim to increase voter turnout by allocating additional polling stations optimally. The final optimization formulation is:
Key Findings
Our analysis examines the relationship between fairness constraints () and their impact on both racial equity and overall voter turnout. The findings reveal important trade-offs between fairness and total turnout impact.
Fairness-Impact Trade-off Analysis
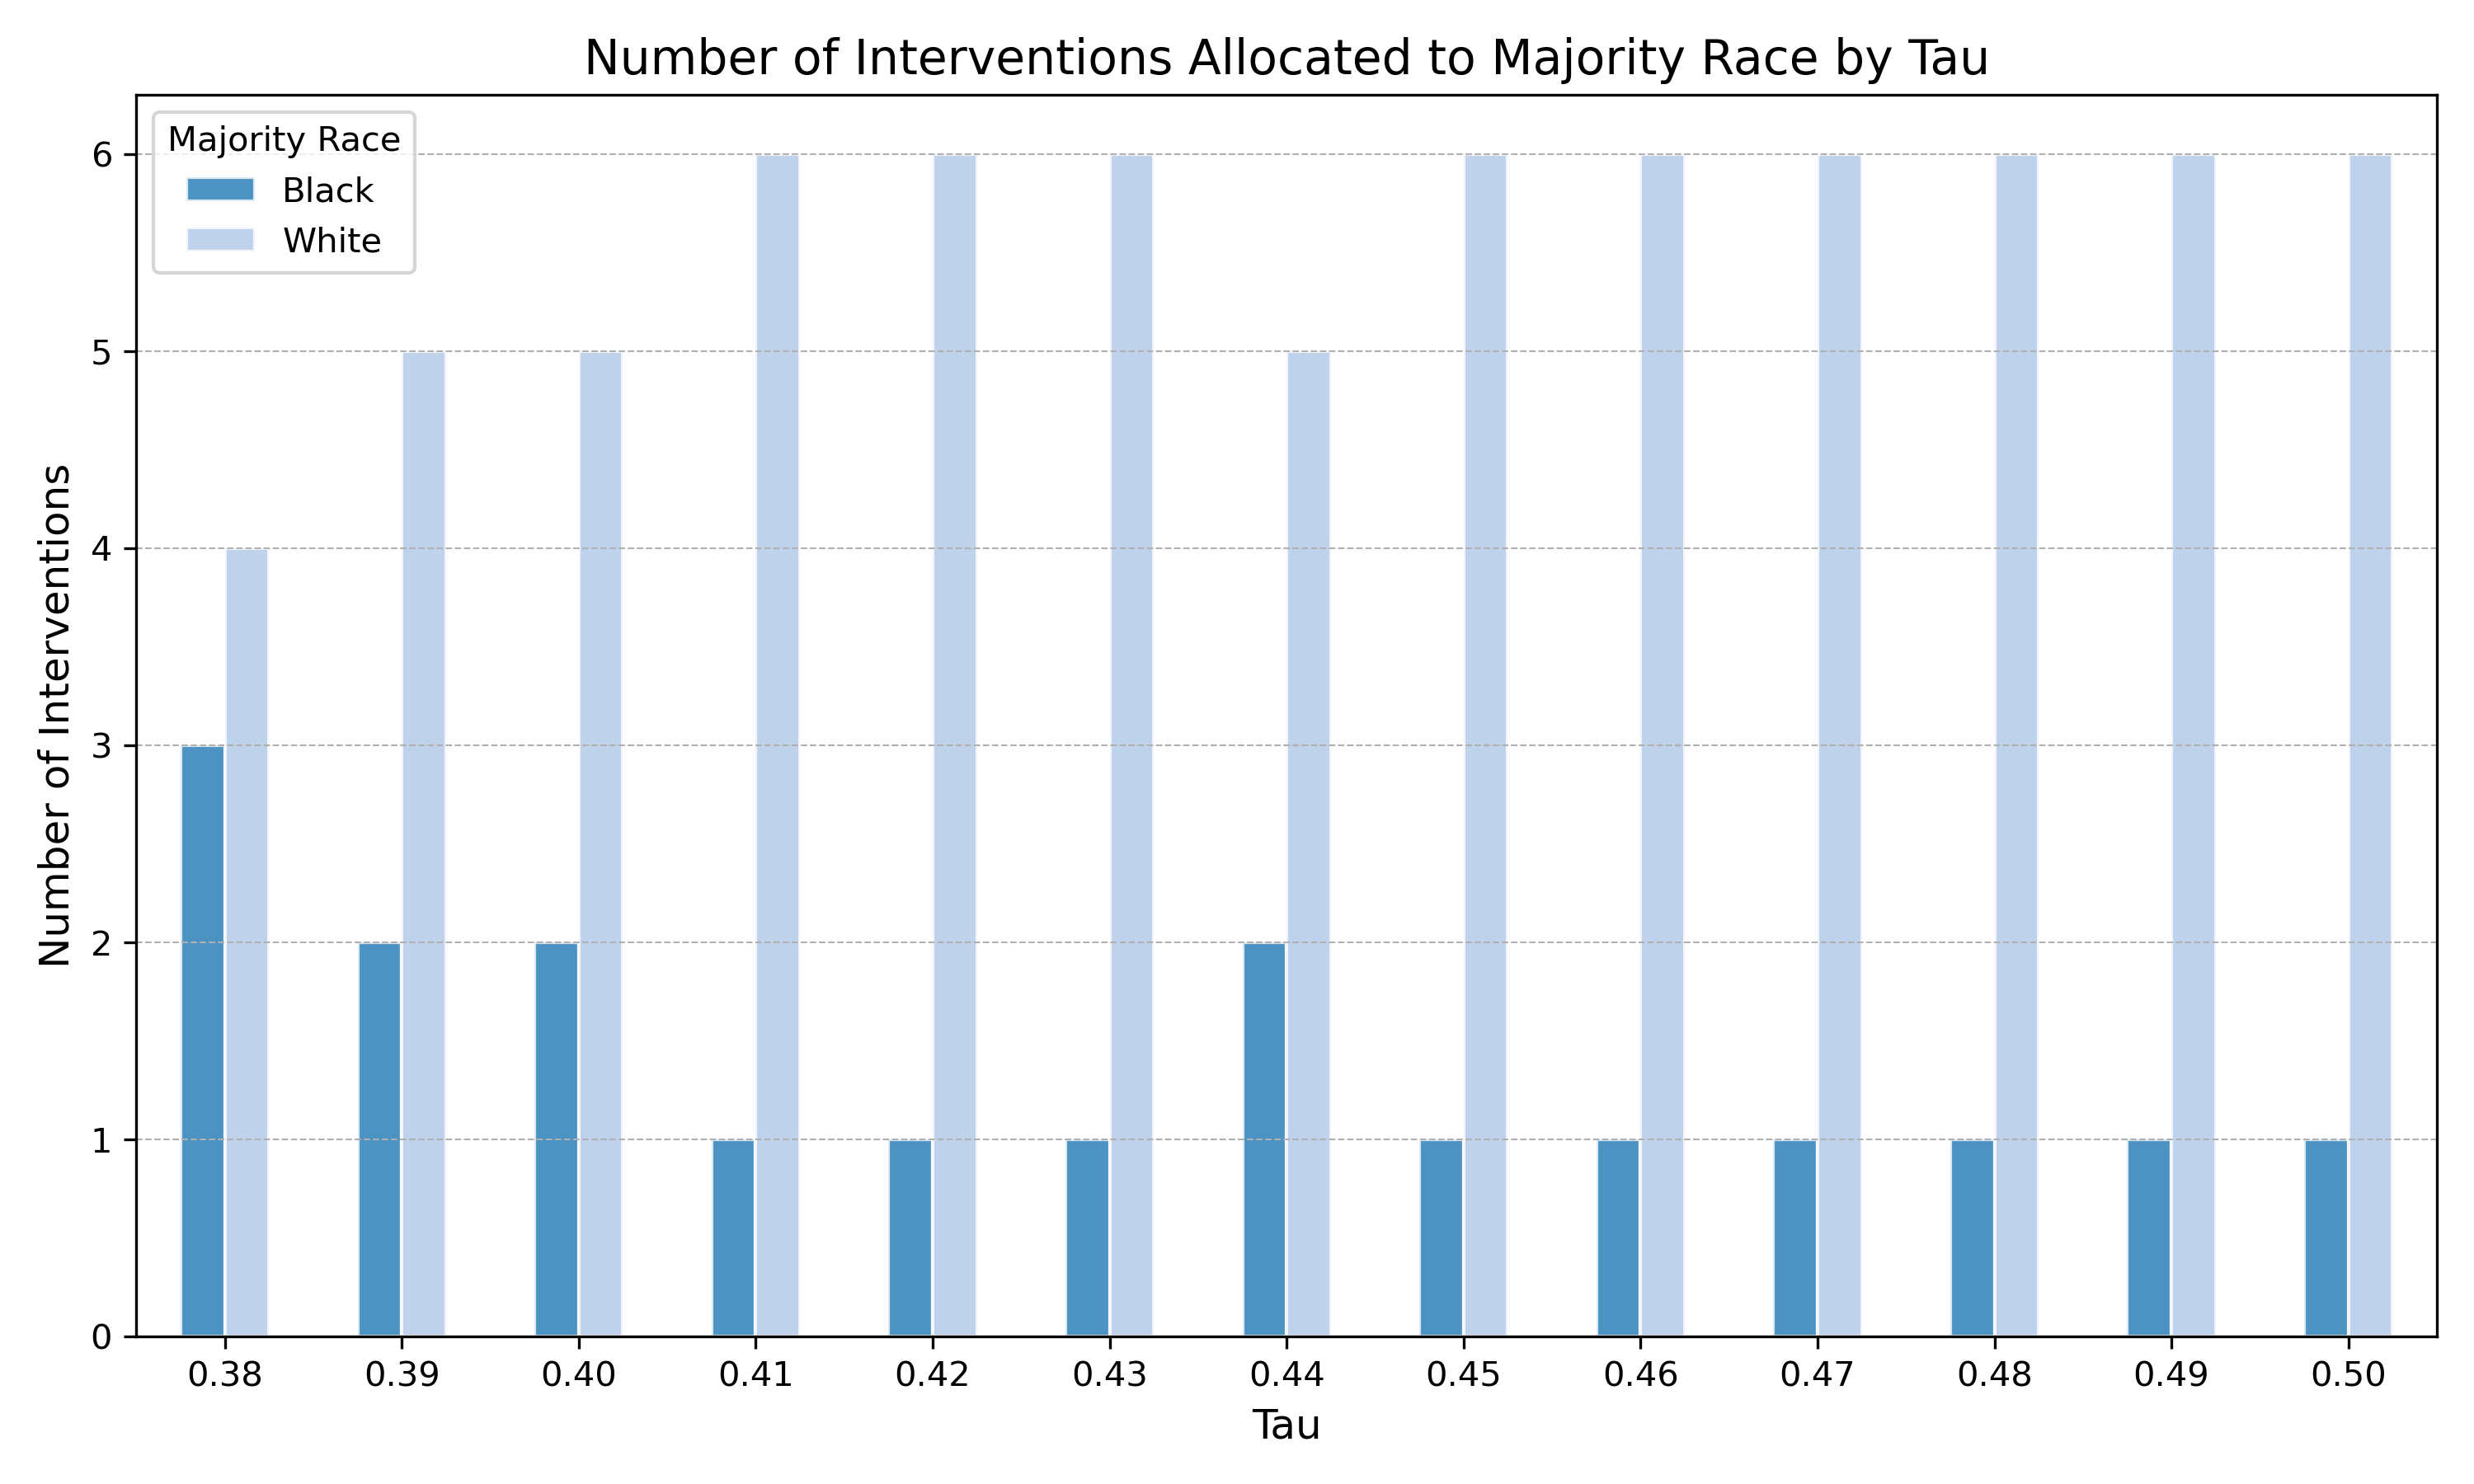
The analysis above demonstrates how varying the fairness constraint () affects both intervention allocation and overall turnout impact.
- Left Panel: Intervention allocation patterns by county majority race
- Increasing (stricter fairness) leads to more equitable distribution across racial groups
- Lower values result in disproportionate allocation to white-majority counties
- Higher values enforce more balanced distribution
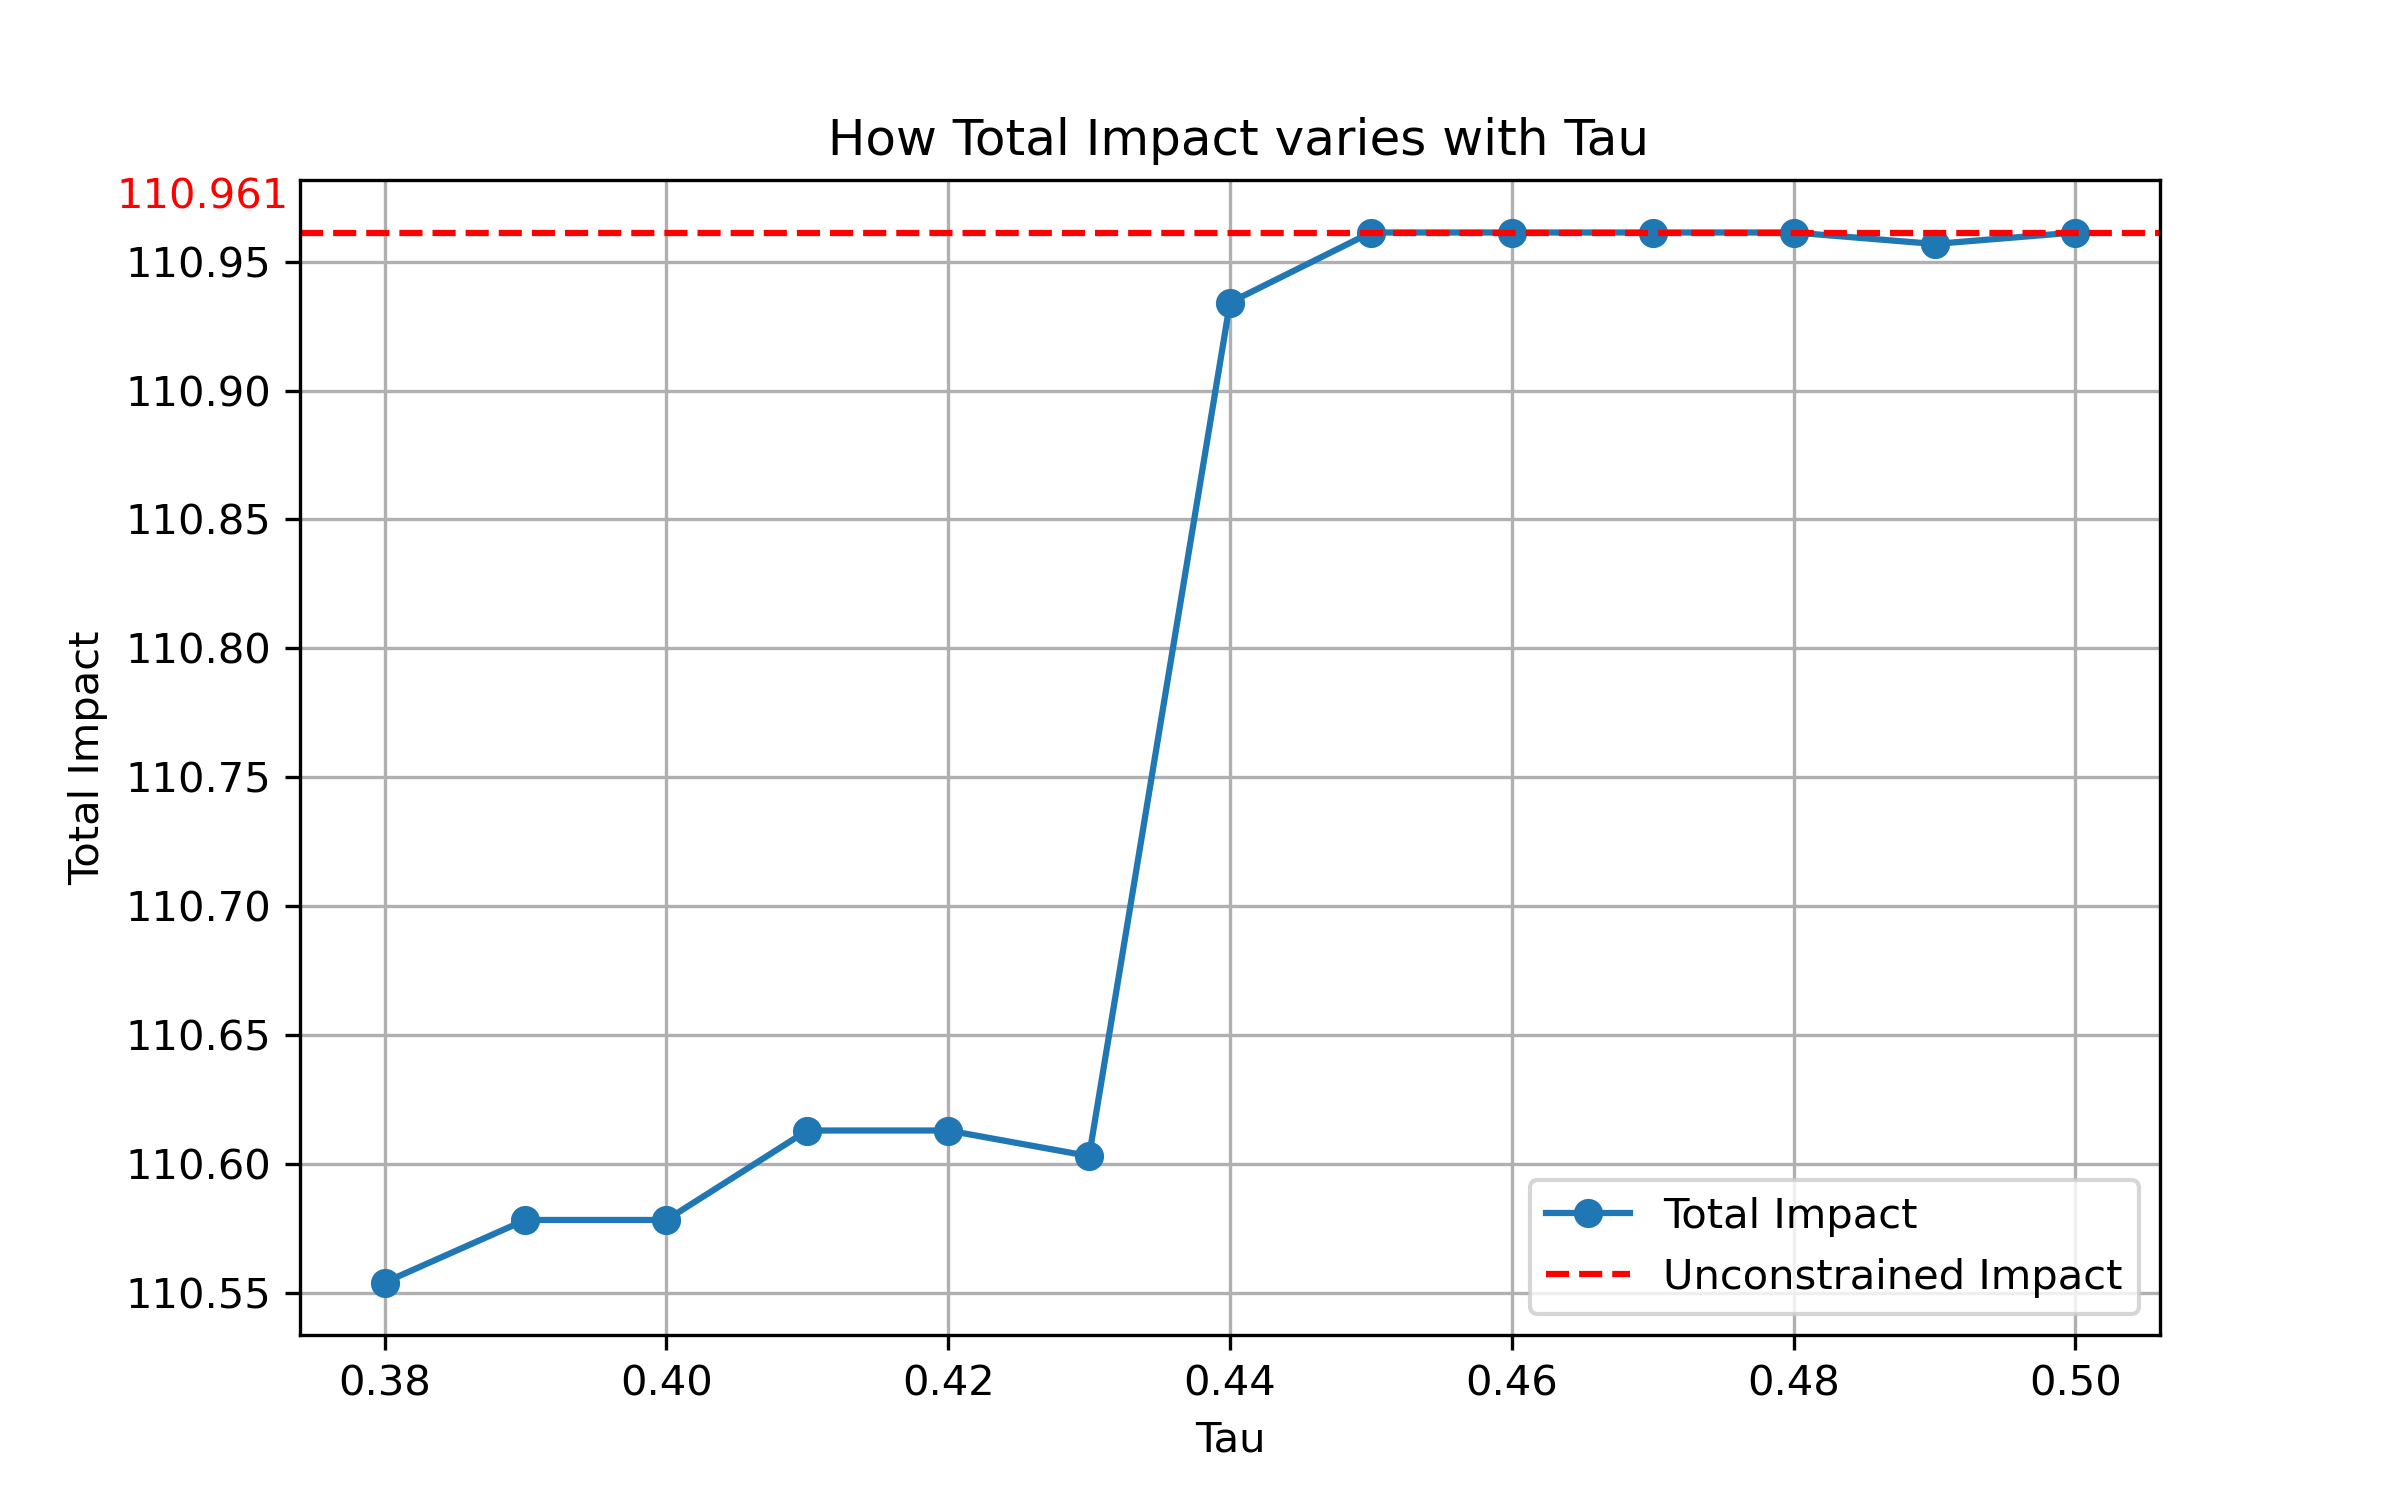
- Right Panel: Impact analysis by fairness constraint
- Total turnout impact increases with , with varying rates of change
- Significant impact gains observed when relaxing tight constraints (low )
- Diminishing returns observed around = 0.43
Geographic Distribution Analysis
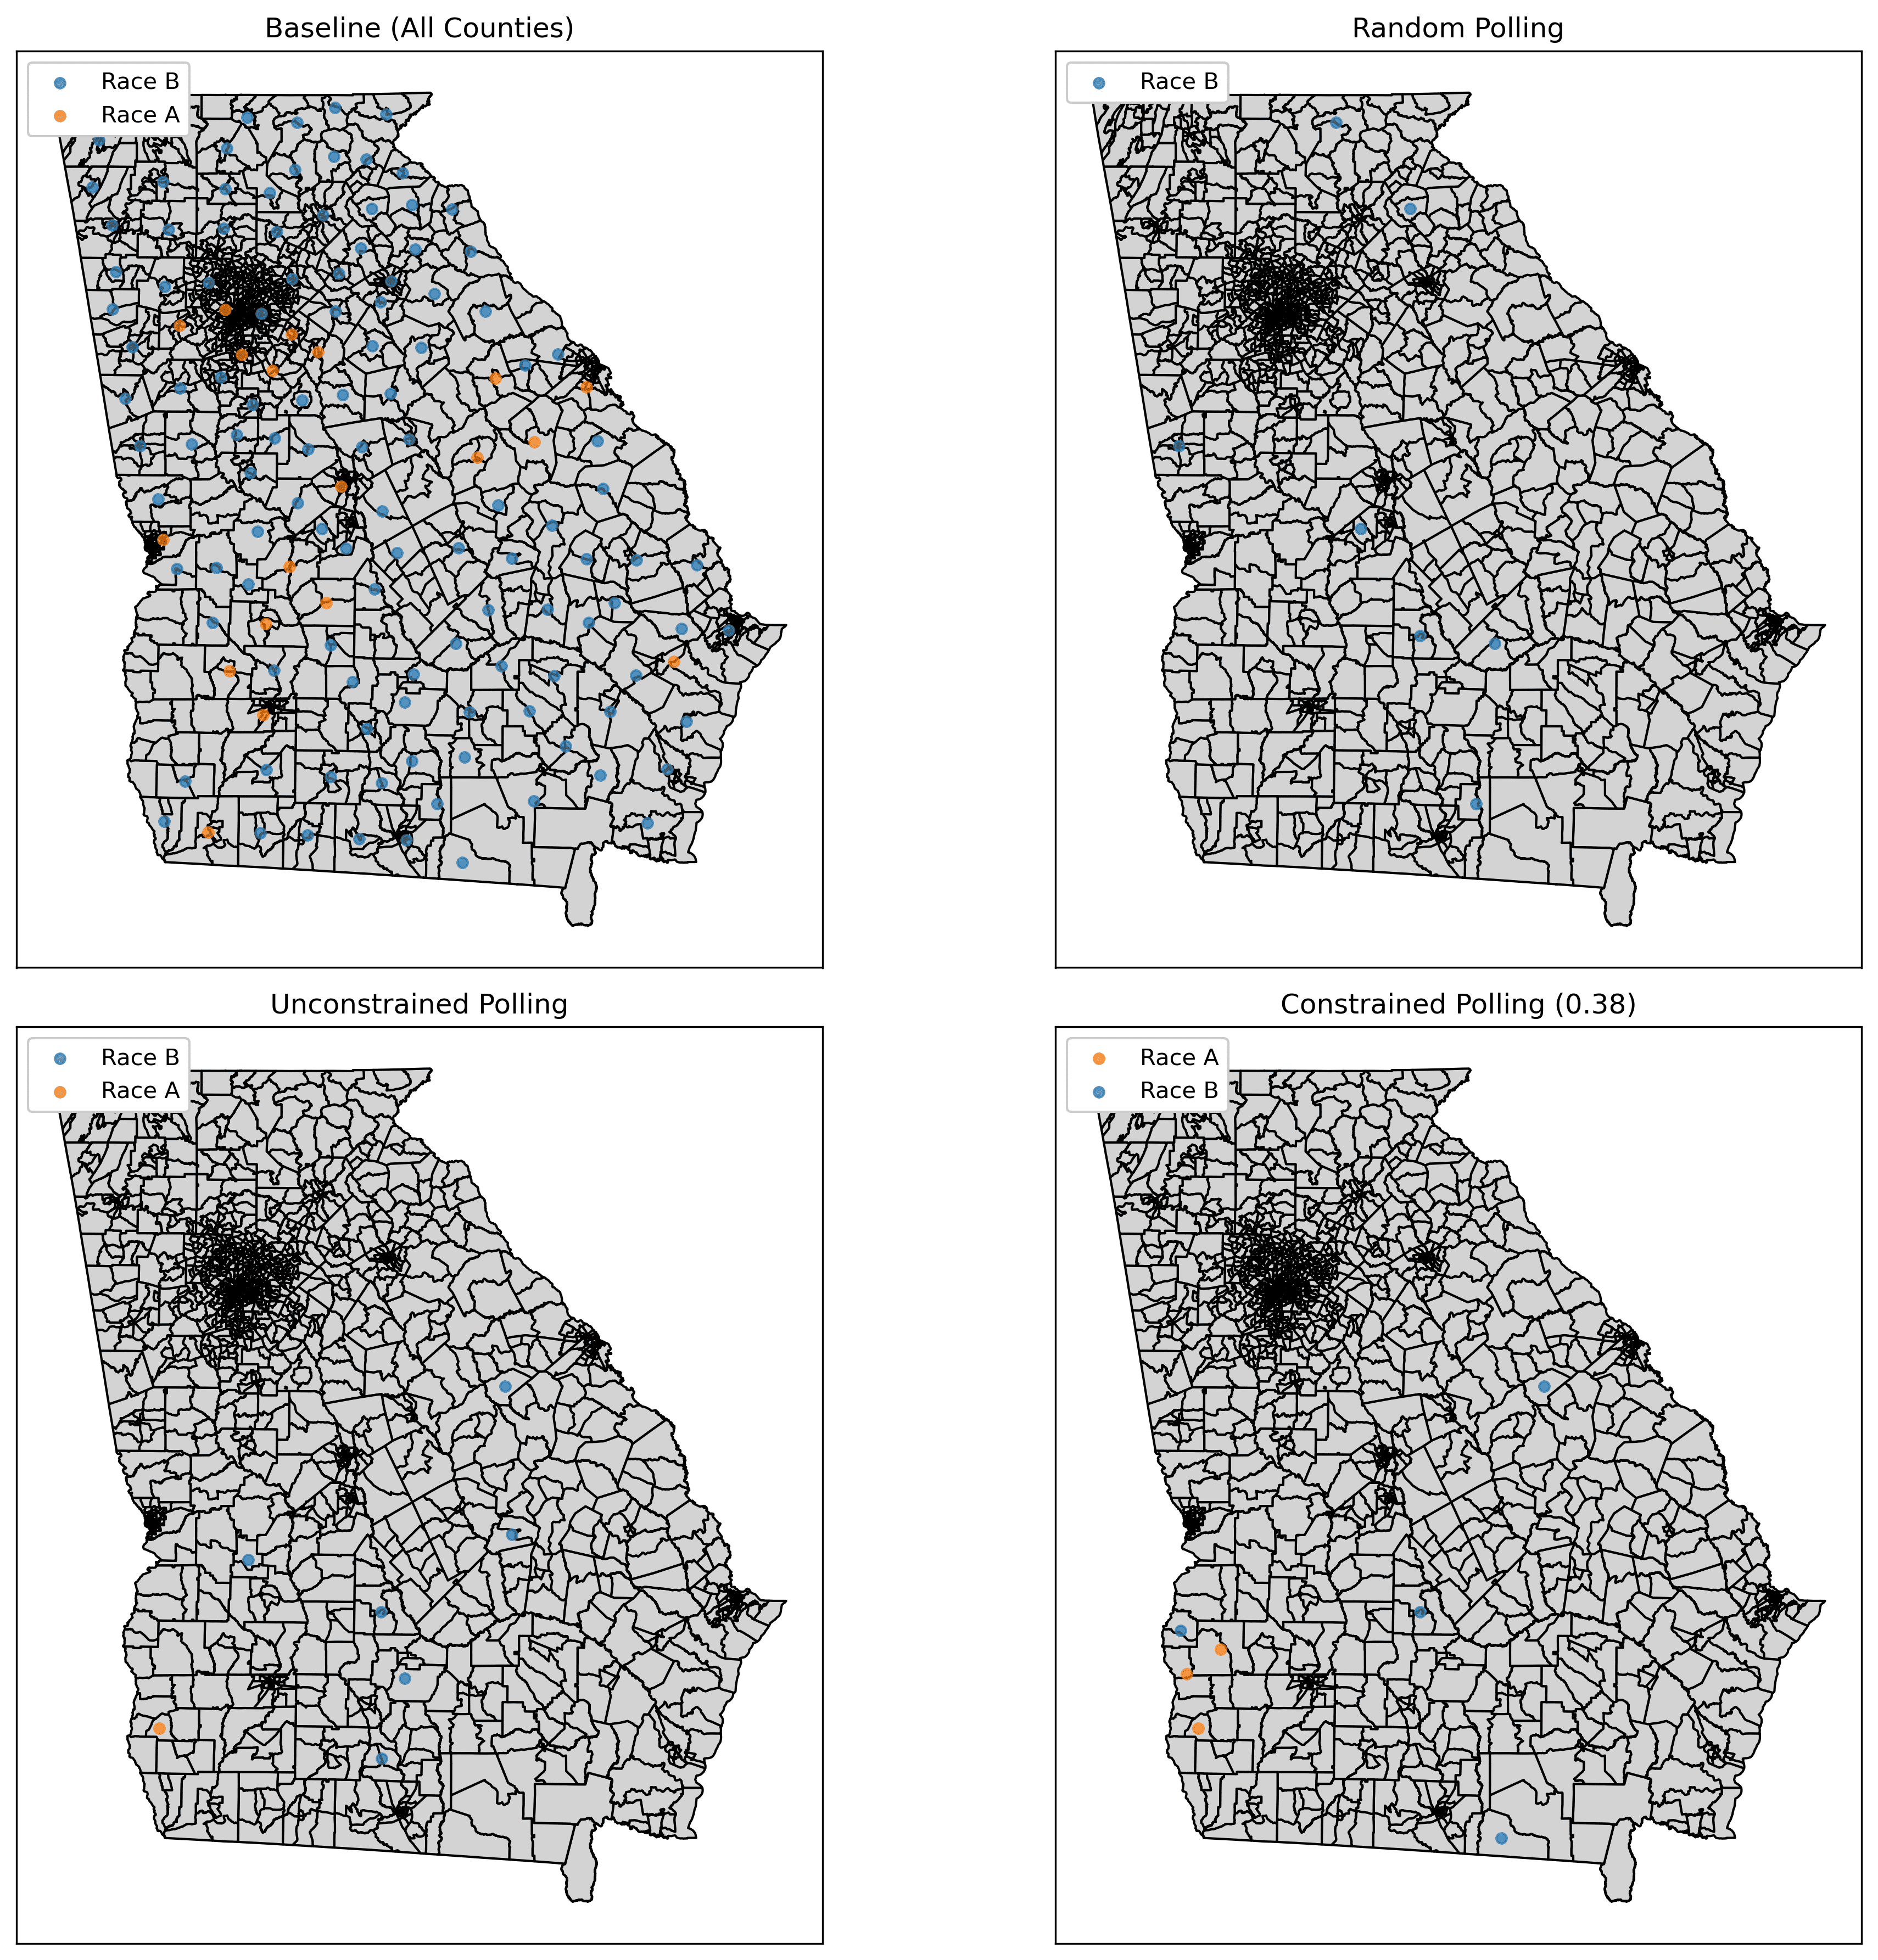
The four maps illustrate different polling station allocation strategies across Georgia:
- Baseline Distribution: Initial polling station configuration
- Random Allocation: Unstructured distribution without optimization
- Unconstrained Optimization: Maximum turnout impact without fairness considerations
- Fairness-Constrained ( = 0.38): Balanced approach considering both impact and equity
Demographic Impact Analysis
The chart above quantifies the turnout impact across different demographic groups under various allocation strategies. The "No Intervention" baseline (all zeros) is omitted for clarity.
Key Findings
- Stricter fairness constraints () achieve more equitable distribution while maintaining near-optimal turnout impact
- Fairness-constrained allocation better aligns with racial equity objectives
- Unconstrained optimization maximizes turnout but exacerbates existing disparities